Dashboards
Dashboards that show your numbers up to date, every day
We bring together your data from Excel, ERP, CRM and other sources in clear dashboards. They update automatically, so nobody has to copy monthly reports together again.
Revenue, last 12 months (€k)
today 06:00 automatically from ERP and CRM
Typical tasks
Dashboards we build
Sales
Revenue, quotes, order intake and pipeline by customer, region or product.
Production and quality
Inspection results, complaints, scrap and delivery reliability over time.
Finance and controlling
Costs, margins and liquidity compared with plan and previous year.
Projects
Status, budget and deadlines of all projects on one page.
Management overview
The company's most important figures for management and board.
Automatic reports
Weekly or monthly summaries by email, with AI commentary on anything unusual.
Demo to try
What this looks like in practice
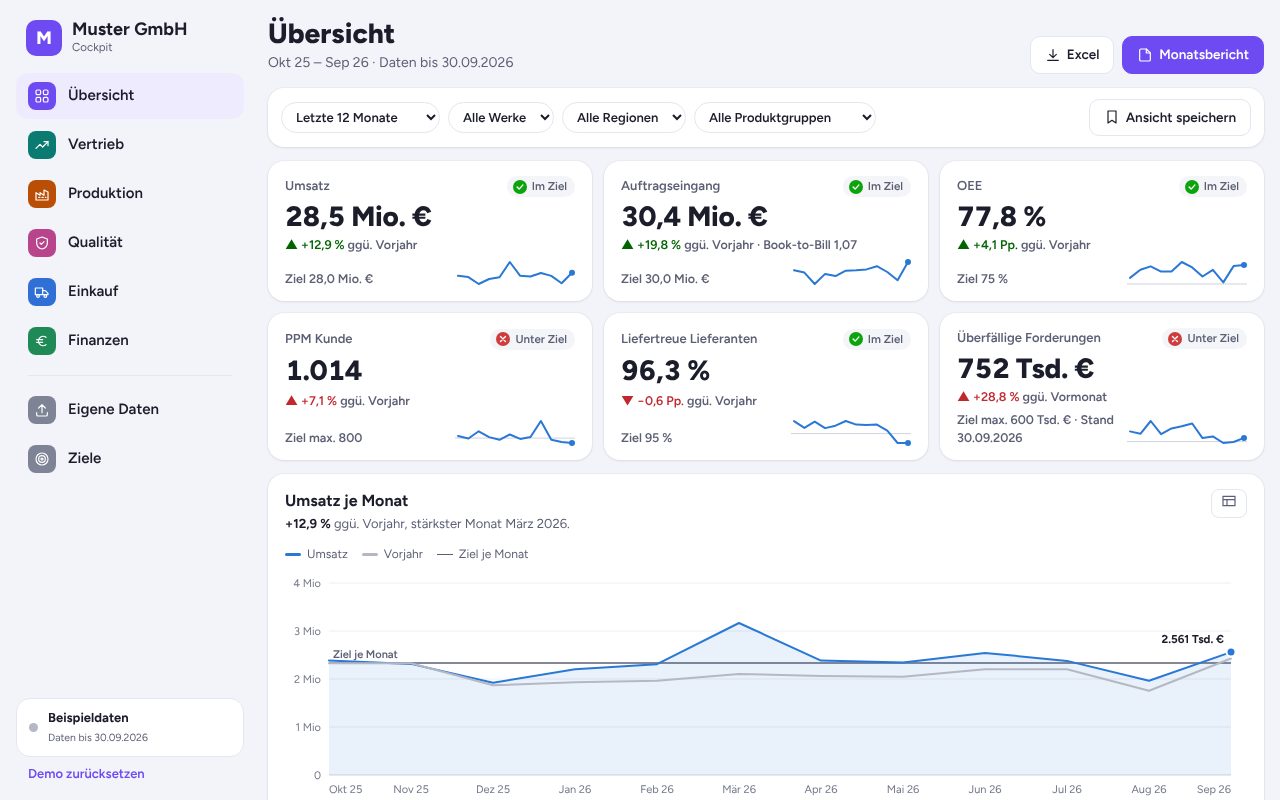
Management cockpit
Sales, production, quality, purchasing and finance at a glance. With drill-down, filters, saved views and Excel upload for your own figures.
Things to try
- Click a KPI to drill down
- Filter by plant and region
- Upload your own Excel file
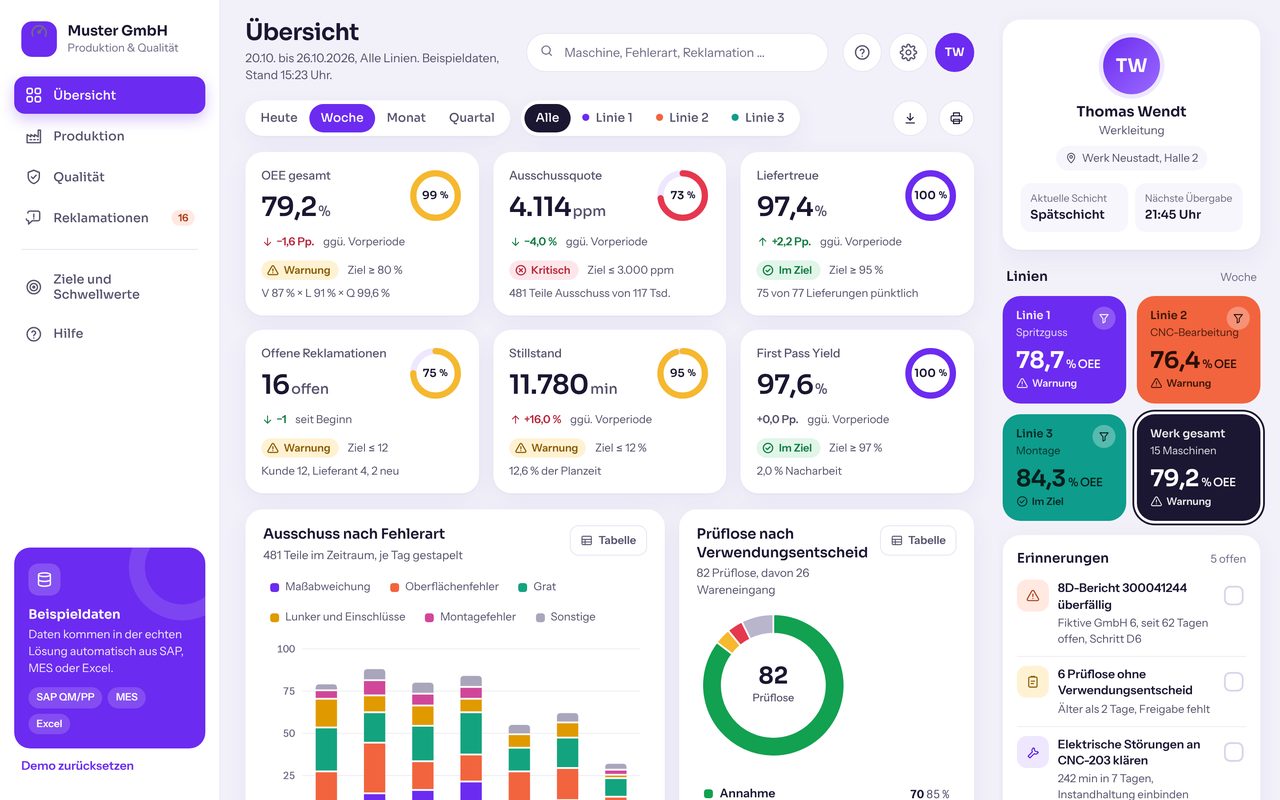
Production and quality cockpit
OEE, scrap in ppm, on-time delivery, downtime, first pass yield and complaints with 8D status. Filter by period, line and machine, with targets and traffic lights.
Things to try
- Tap line 2 and compare OEE
- Open a machine in the heatmap
- Change the OEE target and watch the status
The demos are in German.
See all demosProcess
From first call to finished solution
You see results early and decide step by step how to continue.
- 130 minutes · free
Intro call
We find the task that costs the most time and what a solution would be worth.
- 2about 1 week
Prototype
A clickable draft on its own preview address. You test it with real examples.
- 32 to 6 weeks
Build
Expansion, testing and connection to your systems such as inbox, calendar or accounting.
- 4ongoing
Operations
Hosting, updates and further development on request, for a fixed monthly fee.
FAQ
Answers up front
Which systems can data come from?
Excel and CSV, common ERP and CRM systems, databases and many cloud services with an API.
Who can see the dashboard?
Only authorised people. Access is protected by login, with different views per role on request.
How often is the data updated?
Depending on the source: hourly, daily or close to real time.
Do we need an expensive BI tool?
No. We build the dashboard as a web application, with no ongoing licence fees per user.
Tell us what costs you time
In a free intro call we find out where automation or custom software pays off for you.
Request an intro call